
The global lottery market has undergone a definitive operational shift in recent years. Historically viewed as a static sector dependent on mechanical drawing machines, paper ticket slips, and simple localized marketing campaigns, the contemporary lottery landscape has evolved into a highly sophisticated digital network. Driven by rapid advancements in cloud computing, enterprise business intelligence software, and high-velocity database tracking tools, the modern lottery sector is fundamentally shaped by data analytics. This transformation goes far beyond basic accounting metrics, deeply altering how commercial platforms track consumer preferences, optimize ticket distribution pipelines, deploy marketing capitals, and manage complex operational liabilities.
The Architecture of Next-Generation Consumer Tracking Loops
The primary driver behind the integration of data analytics within contemporary lottery systems is the migration from anonymized retail ticketing toward verified digital accounts, commonly referred to as the iLottery framework. When consumers transition away from traditional cash-in-hand counter purchases to dedicated mobile applications, they establish a continuous, real-time data pipeline for the operator.
Enterprise personalization engines ingest these massive behavioral datasets to build comprehensive, individual user profiles. The underlying algorithms analyze highly specific parameters, such as a player preferred game variations, average transactional spending velocities, historical ticket purchase times, and precise responses to past promotional discounts.
By running these data points through predictive machine learning classification models, operators can eliminate wasteful mass-marketing campaigns. Instead, the system customizes individual player portals dynamically. If an account shows a high concentration of engagement with rapid eInstant digital scratchers on Friday evenings, the platform will automatically trigger targeted notifications or localized promotional incentives precisely within that active playing window, maximizing retention and reducing user friction.
Enhancing Retail and Logistical Operations Through Predictive Models
While digital platforms provide clean pipelines for direct consumer analytics, physical retail storefronts still generate a massive volume of global lottery revenues. Data analytics has completely overhavled how operators manage these brick-and-mortar retail networks, using predictive logistics models to replace legacy manual delivery systems.
Advanced distribution software continuously processes historical sales patterns, local community demographic changes, nearby seasonal traffic spikes, and specific calendar events to calculate localized ticket demand with pinpoint precision. For physical instant scratch-off tickets, this statistical accuracy yields massive structural benefits:
-
Inventory Optimization: Distributors use machine learning forecasts to dispatch the exact quantity of specific game variations that a particular zip code demands, avoiding both lost sales due to empty shelves and tied-up corporate capital from overstocking slow-moving products.
-
Smart Route Logistics: Fleet management platforms analyze real-time transit data and localized retail sales velocities to automatically generate highly efficient routes for delivery drivers, drastically cutting fuel expenditures and lowering operational carbon footprints.
-
Loss Prevention Identification: Machine learning models track localized activation logs and structural return patterns across thousands of individual retail nodes, instantly flagging anomalous transaction sequences that indicate potential internal theft, tracking errors, or localized compliance breaches.
By merging physical distribution variables with centralized data processing centers, lottery enterprises achieve structural efficiencies that maximize profitability across both online and offline retail landscapes.
Deconstructing the Analytics of Smart Ticket Generation Tools
On the consumer side of the equation, the widespread availability of historical draw databases and computational tools has created a new subculture of data-conscious participants. Modern players utilize advanced software tools to analyze millions of past lottery draws, shifting away from generic quick-picks toward data-driven ticket selections.
While data analytics cannot predict the exact sequence of numbers that will emerge from a truly random draw, advanced tracking tools allow players to analyze specific mathematical structures within historical datasets:
-
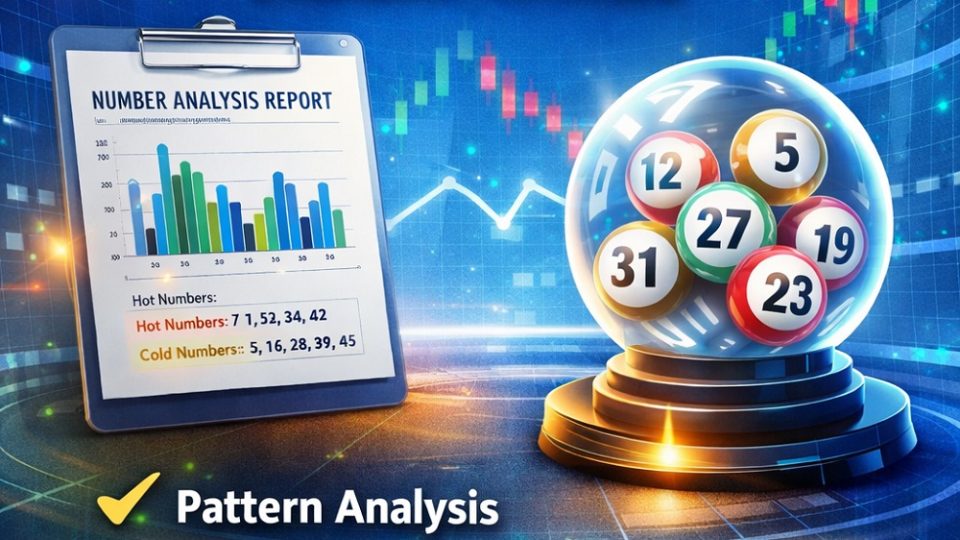
Frequency Matrix Distributions: Software tools classify numbers into hot categories (those drawn frequently within a recent window) and cold categories (those appearing rarely over the same period), allowing participants to build selection models based on historical variance trends.
-
Odd-Even and High-Low Ratio Balancing: Mathematical modeling reveals that over large statistical sample sizes, winning combinations almost always exhibit balanced ratios of odd to even numbers and high to low numbers, preventing players from wasting capital on low-probability selections like consecutive sequential strings.
-
Consecutive Number Pairings: Data mining tools identify common two-number and three-number clusters that appear together more frequently than standard probability curves suggest over short horizons, giving players structural benchmarks to guide their custom grid formulations.
By translating complex combinatorial mathematics into accessible visual dashboards, modern data tools empower players to approach the lottery table with the same analytical framework used by professional financial portfolio managers.
Managing Complex Risk Portfolios and Insurance Frameworks
For private lottery operators and state commissions, managing the immense financial liability associated with massive, surging jackpots is a major corporate challenge. When a prominent multi-state draw rollover triggers an explosive acceleration in ticket sales volume, the operator exposure grows exponentially. Data analytics acts as a vital financial shield, protecting companies from catastrophic payout liabilities through real-time risk modeling.
Actuarial software models simulate billions of potential draw scenarios simultaneously, calculating the precise probability of single or multiple jackpot winners based on current sales velocities and historical grid coverage curves. This real-time analysis allows lottery corporations to optimize their hedging strategies and negotiate highly accurate prize indemnity insurance policies with international financial markets. By understanding their exact mathematical exposure at any given second, operators ensure absolute financial solvency, guaranteeing that even the most extreme jackpot payouts can be settled smoothly without threatening the structural health of the enterprise.
Combating Secondary Market Frauds with Algorithmic Security
As lottery ticketing becomes increasingly digitized, operators must confront sophisticated international fraud syndicates attempting to exploit platform rules. Common vectors include ticket laundering rings, automated bot networks buying out promotional pools, and credential stuffing attacks targeting high-value user wallets.
Artificial intelligence serves as a highly resilient, automated barrier against these modern cyber threats. Rather than relying on simple, rule-based security protocols that only detect known historic patterns, machine learning fraud models analyze the behavior of the entire network holistically. The system establishes a granular baseline of standard consumer activity, tracking typical login locations, standard transaction speeds, and common interface interaction paths. When an individual account or a synchronized cluster of accounts deviates from this baseline, the system takes immediate action, freezing suspicious checking processes and routing the flagged accounts to compliance teams for deep manual evaluation, keeping the playing field safe and balanced for legitimate consumers.
Frequently Asked Questions
Can data analytics help a player mathematically overcome the built-in house edge of a state lottery?
No, data analytics cannot eliminate the fundamental house edge built into certified lottery games. While tracking software helps players avoid making statistically poor combinations, every single draw remains an independent, randomized mathematical event. No amount of historical data analysis can alter the fixed probability of a specific set of numbers appearing on a future turn, ensuring that the house maintains its long-term statistical advantage.
What is the primary difference between a quick-pick ticket and a data-driven manual ticket?
A quick-pick ticket utilizes the internal random number generator of the retail terminal to instantly assign a randomized string of numbers to a card without any pre-planned strategy. A data-driven manual ticket is constructed by a player who has analyzed historical draw frequencies, odd-even distributions, and number pairing metrics to deliberately select a combination that aligns with optimal statistical distributions.
How do lottery operators protect player privacy when tracking detailed consumer data?
Licensed lottery enterprises design their data analytics infrastructure in strict compliance with global privacy regulations like the General Data Protection Regulation and regional state-level privacy acts. The predictive algorithms focus entirely on processed behavioral trends, transaction velocities, and abstract gaming metrics rather than storing direct personal identifiers, ensuring consumer privacy remains fully protected during the processing phase.
How does real-time ticket scanning analytics prevent retail counter fraud?
Real-time scanning analytics connects every physical terminal directly to a centralized monitoring server. When a physical ticket is scanned, the system instantly cross-checks its unique cryptographic barcode, validation time, and purchase location against global database records. This real-time verification loop makes it impossible for bad actors to cash in duplicate copies, altered tickets, or stolen slips, as the system flags discrepancies instantly.
Why do lottery commissions adjust game matrix configurations, and how does data guide those choices?
Lottery commissions utilize predictive market analytics to monitor consumer engagement trends over multi-year cycles. If data indicates that ticket sales are stagnating because a jackpot is won too frequently, engineers adjust the matrix (such as changing a guess pool from 60 to 70 numbers) to intentionally lengthen the odds, driving larger rollovers and creating massive, headline-generating jackpots that naturally spark public purchasing frenzies.
What are second-chance digital ticket drawings and how does data analytics measure their value?
Second-chance digital drawings allow players to enter non-winning tickets into secondary promotional pools by scanning the barcodes with their mobile apps. Data analytics engines track these scans to measure the exact lifetime value of a consumer, analyze how effectively second-chance opportunities bridge the gap between physical retail and online channels, and optimize the types of secondary prizes offered to maximize ongoing brand loyalty.
